We’re really excited to announce we’ve launched a new and improved dashboard!
*this post is mostly relevant to our current publisher clients, though for those of you who aren’t this is a nice peep behind the scenes
Basically, it’s the good old dashboard you’re used to but with a far better user experience which I hope you’ll enjoy. Oh and don’t worry – there’s nothing you need to do! You’ll see it from exactly the same URL you’re used to login from.
Below is a quick walkthrough on how to navigate the new dashboard (though I think you’ll find it intuitive).
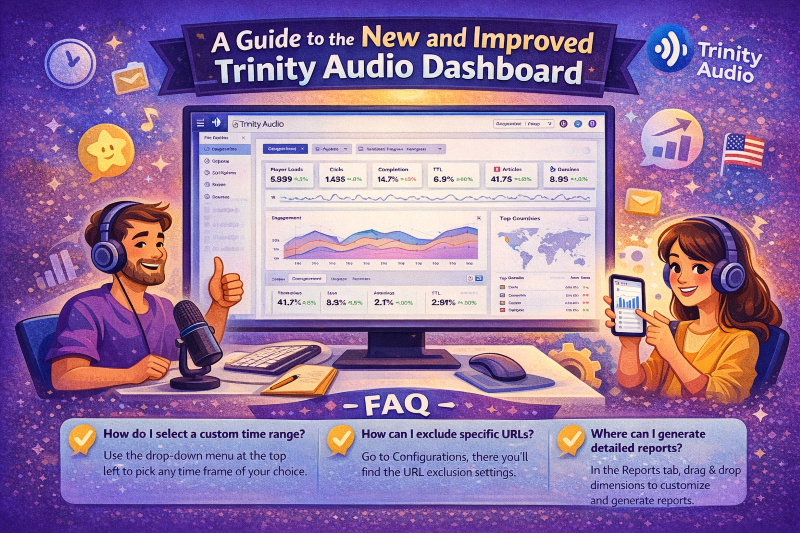
When logging in, you’ll see the following screen:
The top left drop down with the time picker will allow you to pick the time frame for the entire dashboard, all widgets included.
Below that you can see all the KPIs we’re offering a quick glance into:
- Player loads: the number of times the player was loaded on article pages
- Clicks: the number of times users clicked on the player
- Completion: the number of times users listened the content all the way through
- TTL: the total time all users spent listening to the content
- Articles played: the number of articles that were played
- CTR: Click Through Rate (the rate of visitors who clicked on the player)
- LTR: Listen Through Rate (the percentage of content plays that were listened to in its entirety)
- LTD: Listen Through Duration (the average time users spent listening to content)
Player loads: the number of times the player was loaded on article pages
Clicks: the number of times users clicked on the player
Completion: the number of times users listened the content all the way through
TTL: the total time all users spent listening to the content
Articles played: the number of articles that were played
CTR: Click Through Rate (the rate of visitors who clicked on the player)
LTR: Listen Through Rate (the percentage of content plays that were listened to in its entirety)
LTD: Listen Through Duration (the average time users spent listening to content)
Next to each KPI you’ll see green and red arrows with a percentage, indicating the change compared to the previous time frame:
- Today vs yesterday at the same hours (aggregated to the last hour)
- Yesterday vs the day before
- Last 7 days vs the previous 7 days
- This month vs last months on the same days
- Last month vs the month before that
Today vs yesterday at the same hours (aggregated to the last hour)
Yesterday vs the day before
Last 7 days vs the previous 7 days
This month vs last months on the same days
Last month vs the month before that
In the main graph, you’ll notice a drop down in the top right:
By using it you can checkout the different graphs for
- Engagement
- Usage
- Revenue
Engagement
Usage
Revenue
Below, you’ll find the domain’s performance and the countries most listeners are coming from:
Furthermore, the URL exclusion got a new design and is now placed under “Configurations”. (don’t hesitate to read the instructions on the top):
And lastly, we’ve improved the reporting UI:
Choose the time you are interested in (custom date is coming soon) and drag and drop the dimensions and metrics you’re after.
Note that the order of the items placed will affect the resulting table and that you can use the arrows to decide on the order of the content:
We’re all super excited about this release and hope you’ll find this dashboard provides you with a better experience. We’re working around the clock to improve and will keep at it!
Please drop us a line of feedback (good OR bad!) so we’ll know if there’s anything you’d like us to work on, add, improve, or simply to tell us we rock 😉
Viva la audio revolution!