
Introduction
In this manual, we’ll walk you through how to use the reporting widget from the Trinity Audio dashboard. If any questions arise, don’t hesitate to reach out to our team at support@trinityaudio.ai and we’ll make sure to help out.
Usage
Login to your dashboard user and navigate to the reporting tab:

Now, let's review the components that construct the reporting widget:

- Choose report source
- Choose time frame
- Choose dimensions
- Choose metrics
- Reset all choices
- Run the report
- Export the result to CSV
- Change amount of rows per page and move between pages
Choose report source
Choose time frame
Choose dimensions
Choose metrics
Reset all choices
Run the report
Export the result to CSV
Change amount of rows per page and move between pages
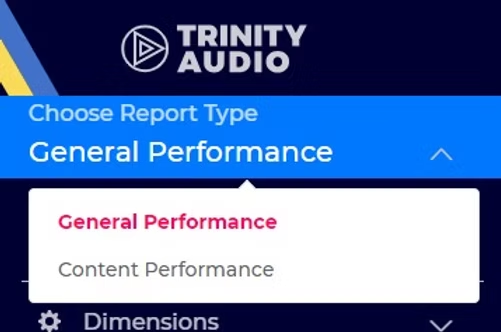
1. Report Source

Choose between the following options:
- General performance: choose this to learn more about the performance of the product based on dimension like Date, user location, visited domain and more.
- Content performance: choose this to learn more about the specific performance of individual stories, sections and more.
General performance: choose this to learn more about the performance of the product based on dimension like Date, user location, visited domain and more.
Content performance: choose this to learn more about the specific performance of individual stories, sections and more.
2. Time frame

Choose the time frame of the report.
Use one of the quick options:
- Today
- Yesterday
- Last 3 days
- Last 7 days
- This month
- Last month
Today
Yesterday
Last 3 days
Last 7 days
This month
Last month
Or use Custom Dates in order to choose the exact dates you would like to report on:

3. Dimensions

Functionality
- All the dimensions that are highlighted and positioned above the line would be included in the report.
- Add at least 1 dimension and maximum 5.
- Add a dimension to the report be clicking on it or dragging it above the line.
- Remove a dimension be dragging it below the line.
- Change the order of the dimensions by dragging to them left and right. Most left dimension would be placed left in the output report.
- Click on the arrows next to each dimension if you would like to order the report based on it.
All the dimensions that are highlighted and positioned above the line would be included in the report.
Add at least 1 dimension and maximum 5.
Add a dimension to the report be clicking on it or dragging it above the line.
Remove a dimension be dragging it below the line.
Change the order of the dimensions by dragging to them left and right. Most left dimension would be placed left in the output report.
Click on the arrows next to each dimension if you would like to order the report based on it.
Options
- Day - The day in a date format
- Hour - Hour of the day (UTC)
- Domain - Top domain (for example:example.com)
- Country - Country users came from (for example: US)
- Device type - The Device the user used (mobile / desktop)
- Player ID - The ID of the player used (see list of ID's in "Configuration / Players")
- Player type - The type of the player used (for example: TTS player / Pulse / etc.)
- Player name - The name of the player
- Partner - Clients can pass such information to the player for internal breakdown.Learn more
- Branded player name - The name of the branded player used
- Theme name - The name of the theme loaded by the player
- AB test - The AB test version used
- Section 1 - First hierarchy of content structure.Learn more
- Section 2 - Second hierarchy of content structure
- Section 3 - Third hierarchy of content structure
- Section 4 - Forth hierarchy of content structure
- Section 5 - Fifth hierarchy of content structure
- Language - The language of the content
- Article ID - Article ID
- Article - The title of the article
Day - The day in a date format
Hour - Hour of the day (UTC)
Domain - Top domain (for example: example.com)
Country - Country users came from (for example: US)
Device type - The Device the user used (mobile / desktop)
Player ID - The ID of the player used (see list of ID's in "Configuration / Players")
Player type - The type of the player used (for example: TTS player / Pulse / etc.)
Player name - The name of the player
Partner - Clients can pass such information to the player for internal breakdown. Learn more
Branded player name - The name of the branded player used
Theme name - The name of the theme loaded by the player
AB test - The AB test version used
Section 1 - First hierarchy of content structure. Learn more
Section 2 - Second hierarchy of content structure
Section 3 - Third hierarchy of content structure
Section 4 - Forth hierarchy of content structure
Section 5 - Fifth hierarchy of content structure
Language - The language of the content
Article ID - Article ID
Article - The title of the article
4. Metrics
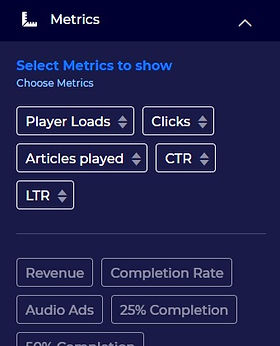
Functionality
- All the dimensions that are highlighted and positioned above the line would be included in the report.
- Add at least 1 dimension.
- Add a dimension to the report be clicking on it or dragging it above the line.
- Remove a dimension be dragging it below the line.
- Change the order of the dimensions by dragging to them left and right. Most left dimension would be placed left in the output report.
- Click on the arrows next to each dimension if you would like to order the report based on it.
All the dimensions that are highlighted and positioned above the line would be included in the report.
Add at least 1 dimension.
Add a dimension to the report be clicking on it or dragging it above the line.
Remove a dimension be dragging it below the line.
Change the order of the dimensions by dragging to them left and right. Most left dimension would be placed left in the output report.
Click on the arrows next to each dimension if you would like to order the report based on it.
Options
- Player Loads - the amount of time the player was load on the page
- Clicks - amount of clicks users made
- Articles played - amount of contents that started to play. If content recommendation is used, it could be higher than clicks
- CTR - Click Through Rate. The amount of clicks divided by viewable player loads
- LTR - Listen through Rate. The percentage of content that was completed by listeners
- Revenue - Revenue from monetizing the player
- Completion Rate - Percentage of plays that got to the end of the content
- Audio Ads - amount of audio ads that were played
- 25% Completion - amount of times users got to 25% of the content
- 50% Completion - amount of times users got to 50% of the content
- 75% Completion - amount of times users got to 75% of the content
- 100% Completion - amount of times users got to 100% of the content
- FAB Play - amount of clicks on the FAB that caused the player to start playing
- FAB Pause - amount of pause clicks made from the FAB view
- FAB Resume - amount of clicks on the FAB view that made the player resume playing
- Viewability - amount of player loads that were actually viewed by the users
- Avg Content Duration - the average duration of the content that played by the users
- Ad Opps - amount of opportunities to play an ad
- Fill Rate - amount of ads played out of the opportunities that the player had
- CPM - the revenue generated for every 1,000 ads
- Player paused - amount of clicks on the player that caused the player to pause the content
- Player resumed - amount of clicks on the player that caused the player to resume the content
Player Loads - the amount of time the player was load on the page
Clicks - amount of clicks users made
Articles played - amount of contents that started to play. If content recommendation is used, it could be higher than clicks
CTR - Click Through Rate. The amount of clicks divided by viewable player loads
LTR - Listen through Rate. The percentage of content that was completed by listeners
Revenue - Revenue from monetizing the player
Completion Rate - Percentage of plays that got to the end of the content
Audio Ads - amount of audio ads that were played
25% Completion - amount of times users got to 25% of the content
50% Completion - amount of times users got to 50% of the content
75% Completion - amount of times users got to 75% of the content
100% Completion - amount of times users got to 100% of the content
FAB Play - amount of clicks on the FAB that caused the player to start playing
FAB Pause - amount of pause clicks made from the FAB view
FAB Resume - amount of clicks on the FAB view that made the player resume playing
Viewability - amount of player loads that were actually viewed by the users
Avg Content Duration - the average duration of the content that played by the users
Ad Opps - amount of opportunities to play an ad
Fill Rate - amount of ads played out of the opportunities that the player had
CPM - the revenue generated for every 1,000 ads
Player paused - amount of clicks on the player that caused the player to pause the content
Player resumed - amount of clicks on the player that caused the player to resume the content
5. Reset all choices
Use this button to reset all selection made for the report.
Conclusion
We hope this guide helps you figure out how to use the reporting widget. If you need any further assistance or have questions, don't hesitate to reach out to our team for support via support@trinityaudio.ai.
Happy listening from all of us at Trinity Audio!